Numerical Transformation R package
NumericTransformation
This package intends to convert categorical features into numerical ones. This will help in employing algorithms and methods that only accept numerical data as input. The main motivation for writing this package is to use in clustering assignments.
Installation
You can install the development version from GitHub with:
# install.packages("devtools")
devtools::install_github("ranibasna/NumericalTransformation")
Example
This is a basic example which shows you how to convert a categorical features to numerical ones:
library(ggplot2)
library(NumericTransformation)
library(dplyr)
## basic example code
# Generate toy data with categorical and numerical columns
n   = 100
prb = 0.5
muk = 1.5
clusid = rep(1:4, each = n)
x1 = sample(c("A","B"), 2*n, replace = TRUE, prob = c(prb, 1-prb))
x1 = c(x1, sample(c("A","B"), 2*n, replace = TRUE, prob = c(1-prb, prb)))
x1 = as.factor(x1)
x2 = sample(c("A","B"), 2*n, replace = TRUE, prob = c(prb, 1-prb))
x2 = c(x2, sample(c("A","B"), 2*n, replace = TRUE, prob = c(1-prb, prb)))
x2 = as.factor(x2)
x3 = c(rnorm(n, mean = -muk), rnorm(n, mean = muk), rnorm(n, mean = -muk), rnorm(n, mean = muk))
x4 = c(rnorm(n, mean = -muk), rnorm(n, mean = muk), rnorm(n, mean = -muk), rnorm(n, mean = muk))
x = data.frame(x1,x2,x3,x4)
summary(x)
# converting the numerical data using UFT_func
x_converted_data = UFT_func(x, Seed = 22)
#head(x_converted_data)
# bined with the rest of the data
x_converted_data_all = bined_converted_func(converted_data = x_converted_data, original_data = x)
head(x_converted_data_all)
x_converted_data_all = x_converted_data_all %>% dplyr::mutate(id = row_number())
head(x_converted_data_all)
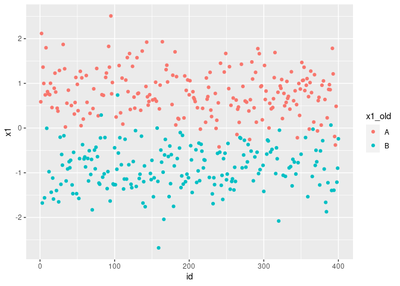
# plotiing
# adding old non-numerical features
x_converted_data_all$x1_old = x$x1
ggplot(x_converted_data_all, aes(x=id, y=x1, color=x1_old)) + geom_point()
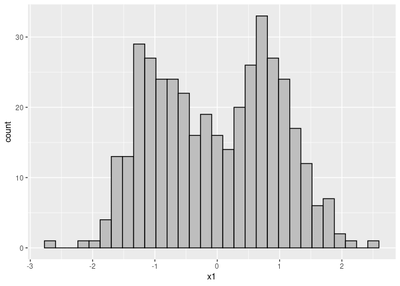
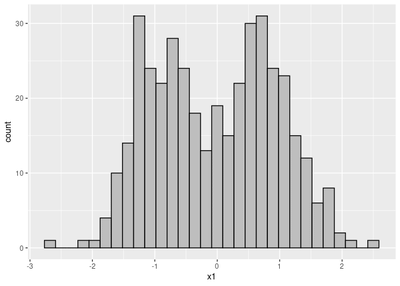
ggplot(x_converted_data_all, aes(x=x1), color=x1_old) + geom_histogram(bins = 30, color = "black", fill = "gray")
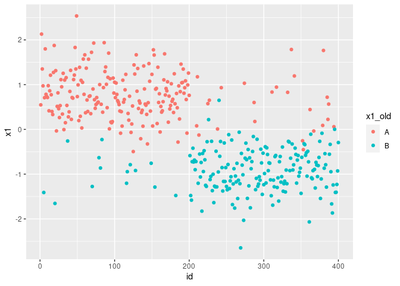
to see clusters
n   = 100
prb = 0.9 # we put the prb to 0.9 for clear clusters
muk = 1.5
clusid = rep(1:4, each = n)
x1 = sample(c("A","B"), 2*n, replace = TRUE, prob = c(prb, 1-prb))
x1 = c(x1, sample(c("A","B"), 2*n, replace = TRUE, prob = c(1-prb, prb)))
x1 = as.factor(x1)
x2 = sample(c("A","B"), 2*n, replace = TRUE, prob = c(prb, 1-prb))
x2 = c(x2, sample(c("A","B"), 2*n, replace = TRUE, prob = c(1-prb, prb)))
x2 = as.factor(x2)
x3 = c(rnorm(n, mean = -muk), rnorm(n, mean = muk), rnorm(n, mean = -muk), rnorm(n, mean = muk))
x4 = c(rnorm(n, mean = -muk), rnorm(n, mean = muk), rnorm(n, mean = -muk), rnorm(n, mean = muk))
x = data.frame(x1,x2,x3,x4)
# converting the numerical data using UFT_func
x_converted_data = UFT_func(x, Seed = 22)
#head(x_converted_data)
# bined with the rest of the data
x_converted_data_all = bined_converted_func(converted_data = x_converted_data, original_data = x)
head(x_converted_data_all)
# plotiing
x_converted_data_all = x_converted_data_all %>% mutate(id = row_number())
# adding old non-numerical features
x_converted_data_all$x1_old = x$x1
ggplot(x_converted_data_all, aes(x=id, y=x1, color=x1_old)) + geom_point()
ggplot(x_converted_data_all, aes(x=x1), color=x1_old) + geom_histogram(bins = 30, color = "black", fill = "gray")
Rani Basna
Researcher | Data Scientist | Mathematician
My research interests include Machine learning, mathematical statistics, Mean field game theory, functional data analysis.